
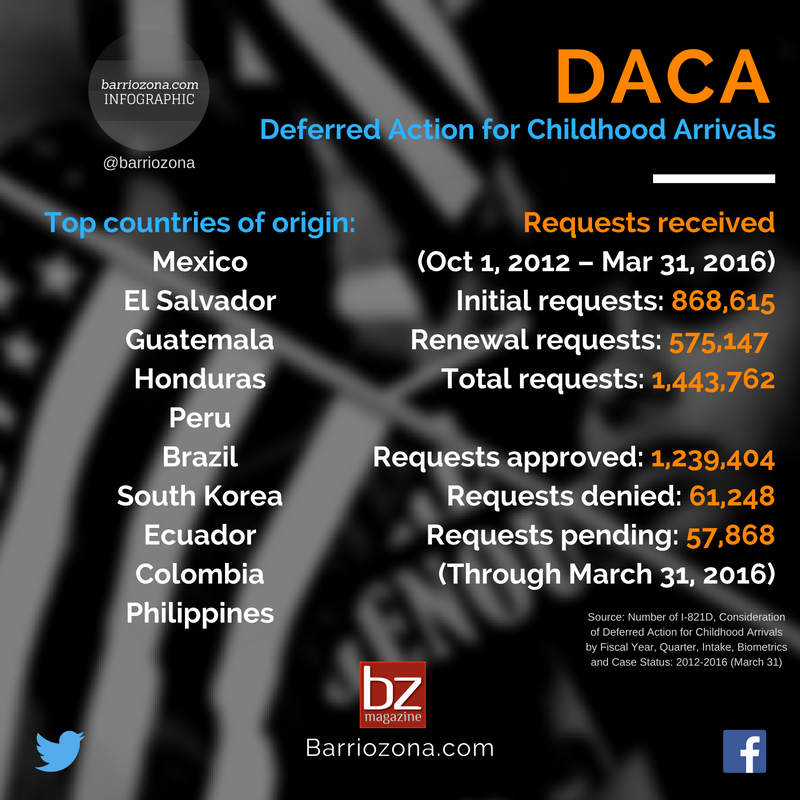
This infographic shows the total of Deferred Action for Childhood Arrivals (DACA) requests received by the United States Citizenship and Immigration Services for the October 1, 2012 – March 31, 2016.
(DACA) requests received by the United States Citizenship and Immigration Services for the October 1, 2012 – March 31, 2016.
Initial requests: 868,615
Renewal requests 575,147
Total requests: 1,443,762
(through March 31, 2016)
Requests approved: 1,239,404
Requests denied: 61,248
Requests pending: 57,868
(through March 31, 2016)
It also shows the top ten applicants’ countries of origin:
Mexico
El Salvador
Guatemala
Honduras
Peru
Brazil
South Korea
Ecuador
Colombia
Philippines
Source: Number of I-821D, Consideration of Deferred Action for Childhood Arrivals by Fiscal Year, Quarter, Intake, Biometrics and Case Status: 2012-2016 (March 31)
Related article: Acción diferida para obtener permisos de trabajo para jóvenes
© 2016 – 2023, Eduardo Barraza. All rights reserved.